


Measurement program UA-200A/200/10
Control the UA series main unit and collect and save measurement data and perform various analyzes and evaluations (Standard accessory)
Outline
Standard software included with the UA-200A / UA-200 / UA-10.
Control the measuring instrument from a personal computer.
The measurement data is collected, saved, and the measured value is replaced with an image and displayed.
With a variety of information processing, perform efficient evaluation in a short time from measurement to data analysis.
| UA-200 series | UA-10 series |
| UA-200AS | UA-10SL |
| UA-200AWS | UA-10SH |
| UA-200AT | UA-10WL |
| UA-200ATW | UA-10WH |
| UA-200S | UA-10TL |
| UA-200WS | UA-10TH |
| UA-200T | |
| UA-200TW |
Click the product name to open the product page.
Features
Offer two modes mounted as below using for anywhere
-Standard Mode: Perform all functions including control and measurement of the UA-200A main unit.
-View Mode: Viewer for browse and analyze saved measurement images.
Analysis anywhere with measured data.
SDK (Software Development Kit) mounted as standard tool.
Software development kit for externally control the UA-200 etc. from a PC on the network consisting of a header file and a library.
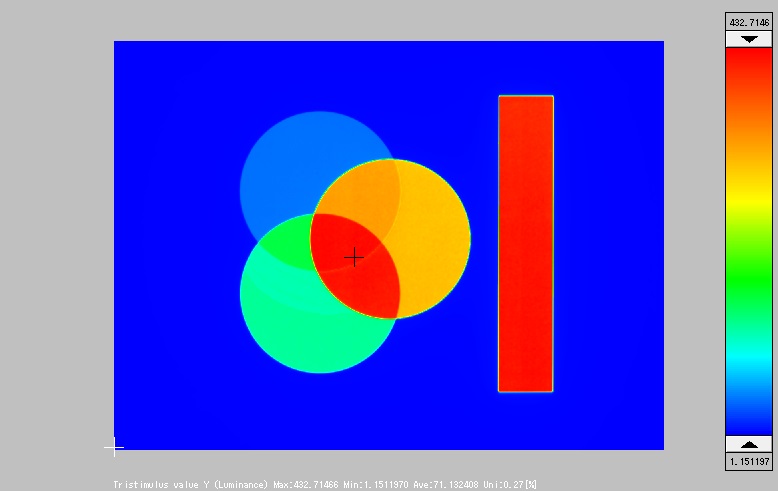
Pseudo color view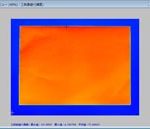 Software-colored image and 16,384 steps gray scale present the difference in luminance / chromaticity on measuring area. This view is suitable for uniformity measuring. |
Contour view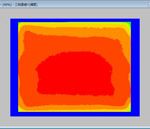 This view use contour lines to indicate the profile of each tristimulus value. |
Split spot view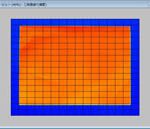 The Image divided with grid pattern shows in this view. Average value in the each divided area is calculated. |
Standard spot view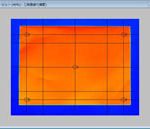 Four type of Measuring standard available such as JEITA standard (EIAJ ED-2522/ ED-2710). You can customize the measur in spot size and the number of measuring spot. |
Random spot view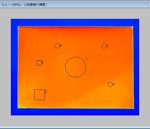 Max 999 measuring spots can be placed on an image. Shape of measuring spots can be selected from Circle, Rectangle, Polygon (max 127 vertex). |
Cross section view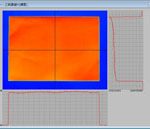 Tristimulus value on the cross-section line is expressed as graph. The cross-section line are selectable from cross line or diagonal line(max.10 lines). |
x,y /u’,v’Chromaticity diagram view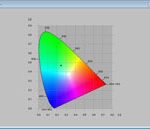 Chromaticity value on the spot can be plotted on the x,y or u’,v’ diagram. The plotted diagram can be scaled up. |
3D view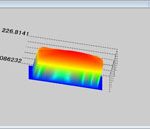 Tristimulus value on the measuring area is expressed as 3D. |
Histogram View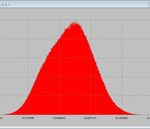 The statistical graphics indicates the frequency of occurrence in the vertical axis and the tristimulus value in the horizontal axis. |
Thumbnail view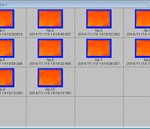 Image data with the number,measured date show as thumbnails. |
Time-series graph view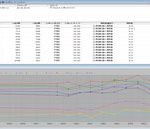 The variation of measured data with lapse of time shows. |
Object color display Measurement view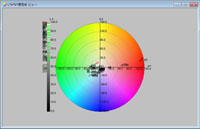 On the software, the object color value calculates and display result from the white plate data and the measured data. |
RGB view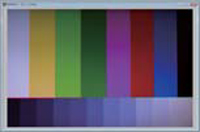 Measurement object is displayed to be close to the actual color. |
Save various viewer measurement data as a CSV format.
Save various viewer as a image (BMP / JPG / PNG).
Specifications
| Function | Overview |
|---|---|
| Focusing assistant function | Show score values in real-time view for accurate focus adjustment. |
| Optimization area | Set the optimum measurement conditions for the measurement area specified on the live screen. |
| Image rotation | Input the angle directly or rotate the image tilted target on the live view or pseudo color view. |
| Frequency setting | Stable measurement with setting the lighting frequency of the pulse light source. |
| Trimming | Easily trim anyplace in the pseudo viewer with specifying the mouse range. |
| Chromaticity color (x,y / u’,v’) | Display in the color tone of the chromaticity expression color in the pseudo viewer. |
| Pseudo color bar | Slide the color bar of the pseudo viewer adjust the color display range and display widely interval of color arrangement on the lower side limit with logarithmic display. |
| Chromaticity judgment area | Set the chromaticity area applied to the judging results view in the chromaticity viewer. |
| Section view | Set up to 10 of cross-sectional views and simultaneously display. |
| Polygon setting | Set up to 17 polygonal areas in any spot in the random spot viewer. |
| Judgment result view | Judge to pass / fail with setting judgment conditions such as luminance and chromaticity etc. |
| Diagonal correction | Perform the image correction of the tilt angle for area of the luminance target surface. |
| Arithmetic operations | Create a comparative measurement image with the calculate add / subtract / multiply / divide between the measurement images. |
| Area correction function | Apply correction factors each area with the measurement surface divided into areas of 2 x 2 to a maximum of 64 x 64. |
| Multipoint correction | Calculate and apply correction factors for multiple colors. |
| Black Mura | Analysis function for displays that supports the Black MURA standard of DFF’s OEM vehicle group. (Additional optional software program) |
Operating condition
| OS | ・Windows 7 Ultimate (32bit/64bit) ・Windows 7 Professional (32bit/64bit) ・Windows 8.1 Pro (32bit/64bit) ・Windows 10 Pro (32bit/64bit) |
|---|---|
| CPU | Intel Core i5 (4 Core 2.8GHz)以上 |
| HDD | 1GB or more |
| Memory | 4GB or more |
| LAN port | Gigabit Ethernet : 1port *RS-232C serial or USB1.1 : another 1 port is required when using reference instrument for color correction. |
| Display | 1,024×768 or more, 16,770,000 color (32bit) or more |
| Other | CD-ROM Drive |