


Colorimetry Program CS-900A
Main unit control and data processing are possible with simple operation! (Standard accessory)
Outline
Application software for Windows that supports measurement of Topcon Technohouse luminance meter-class.
In addition to the conventional SR series, various models can be measured.
It is possible to easily control the main unit of brightness meters, collect, save, graph, and calculate measurement data on a personal computer.
Compatible models
| Spectral mode | Colorimetry mode | NIR mode | Illuminance mode | |
|---|---|---|---|---|
| SR-LEDW-5N | ● | ● | – | ●(*1) |
| SR-LEDW | ● | ● | – | ●(*1) |
| SR-LEDH | ● | ● | – | ●(*1) |
| SR-UL2 | ● | ● | – | ●(*1) |
| SR-UL1R | ● | ● | – | ●(*1) |
| SR-3AR | ● | ● | – | ●(*1) |
| SR-NIR | – | – | ● | – |
| BM-5AC | – | ● | – | – |
| BM-7AS BM-7AS-ANA |
– | ● | – | – |
| RD-80SA | – | ● | – | – |
| IM-1000 | – | – | – | ● |
| SR-UL1 SR-3 SR-3A SR-3A-L1 SR-LED (*Discontinued Products) |
● | ● | – | ●(*1) |
| BM-5AS BM-7A BM-7A-ANA (*Discontinued Products) |
– | ● | – | – |
Features
◾Easy control of various luminance meters and data processing.
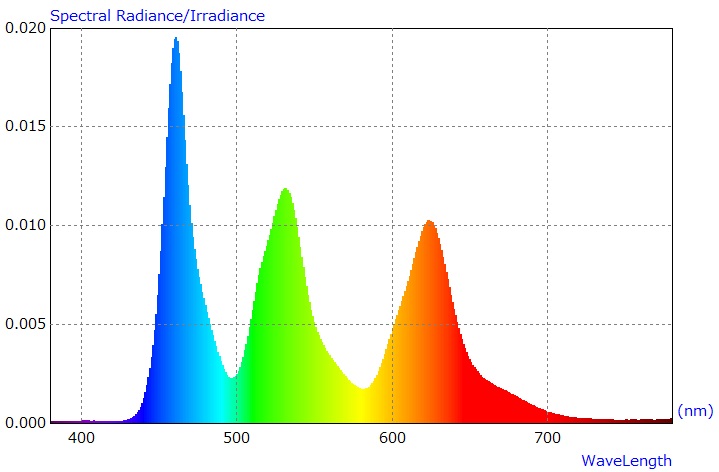
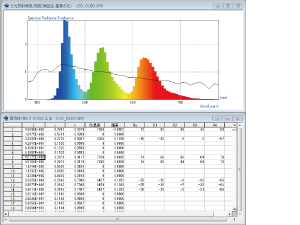
◾Spectral mode” that can be used with the SR series can be measured spectral radiance and color rendering.
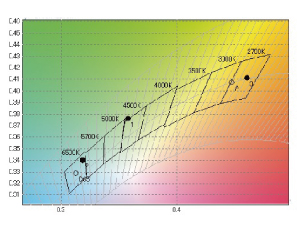
◾”Colorimetry mode” can be measured in a short time only colorimetric data such as brightness, chromaticity, and color temperature.
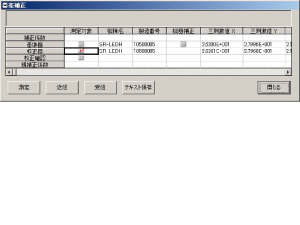
◾Correction factors such as attachment lens and neutral density filter can be applied on the PC.
◾”Near-infrared spectral mode” exclusively for SR-NIR can be measured and evaluated Near-infrared spectral radiance.
|
||||||
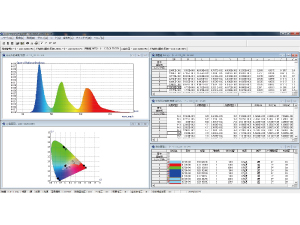 Arbitrarily setting of graph layouts and data sheets |
Confirm a single screen of the spectral distribution, chromaticity and measurement data
|
|||||
|
|
|||||
|
|
|||||
|
|
|||||
Specifications
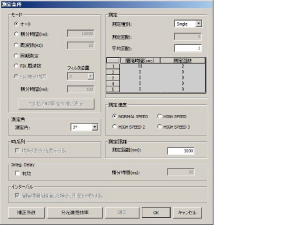
◾ Setting of measurement conditions (Auto / Frequency / Integration time / Integration Delay / Sync / FIX)
◾ Manual setting of measurement range
◾ Measurement angle switching (SR series only)
◾ Setting the number of measurements (Single / Interval / Continue, averaging)
◾ Correction coefficient setting
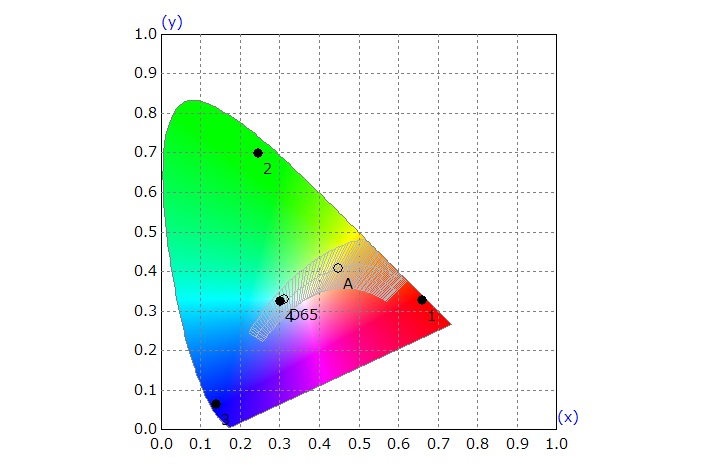
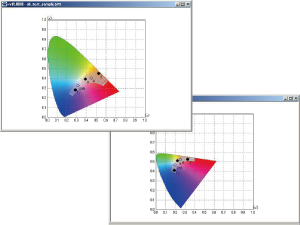
◾ Imaging of spectral distribution / chromaticity graph
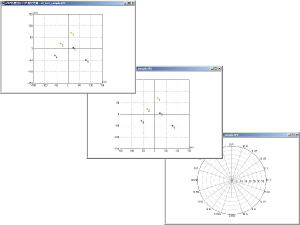
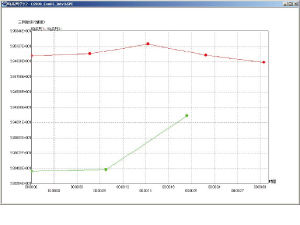
◾ Graphing time series data during continuous / interval measurement
◾ Field of view / light source setting, color rendering evaluation
| Spectral mode | Colorimetry mode | NIR mode | Illuminance mode | |
|---|---|---|---|---|
| Spectral radiance | ● | ● | ||
| Spectral irradiance | ● | |||
| Luminance | ● | |||
| Illuminance | ● | |||
| Luminous intensity | ● | |||
| Chromaticity | ● | ● | ● | |
| Tristimulus value | ● | ● | ● | |
| Radiance | ● | |||
| Irradiance | ● | |||
| Correlated color temperature | ● | ● | ● | |
| deviation | ● | ● | ● | |
| Dominant wavelength | ● | ● | ● | |
| Stimulation purity | ● | ● | ● |
Operating condition
| OS | ・Windows 7 Ultimate (32bit/64bit) ・Windows 7 Professional (32bit/64bit) ・Windows 8.1 Pro (32bit/64bit) ・Windows 10 Pro (32bit/64bit) |
|---|---|
| CPU | Intel Core i3 2.4GHz以上 |
| HDD | 1GB以上 |
| Memory | 1GB以上 |
| Port | USB2.0 port x 1 or RS-232C Serial port x 1 |
| Display Device | Resolution:1024×768 or higher 16.7 milion colors (32bit) or more |
| Others | CD-ROM dirve |